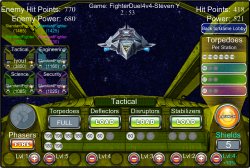

MathScore EduFighter is one of the best math games on the Internet today. You can start playing for free!
Colorado Math Standards - 10th Grade
MathScore aligns to the Colorado Math Standards for 10th Grade. The standards appear below along with the MathScore topics that match. If you click on a topic name, you will see sample problems at varying degrees of difficulty that MathScore generated. When students use our program, the difficulty of the problems will automatically adapt based on individual performance, resulting in not only true differentiated instruction, but a challenging game-like experience.
Want unlimited math worksheets? Learn more about our online math practice software.
View the Colorado Math Standards at other levels.
Number Sense
1.1 Demonstrate meanings for real numbers, absolute value, and scientific notation using physical materials and technology in problem solving situations. (Absolute Value 1 , Absolute Value 2 , Absolute Value Equations )1.1a Compare and order sets of real numbers.
1.1b Recognize and use equivalent representations of real numbers in a variety of forms including scientific notation, radicals, and other irrational numbers such as p. (Scientific Notation 2 , Scientific Notation )
1.1c Use very large and very small numbers in real life situations to solve problems (for example, understanding the size of the national debt).
1.2 Develop, test, and conjectures about the properties of number systems and sets of numbers.
1.2a Develop and test conjectures about the properties of the real number system and common subsets of the real number system (for example, counting numbers, integers, rationals).
1.2b Verify and apply the properties of the operation "to the power of". (Exponents Of Fractional Bases , Negative Exponents Of Fractional Bases , Multiplying and Dividing Exponent Expressions , Exponent Rules For Fractions )
1.3 Use number sense to estimate and justify the reasonableness of solutions to problems involving real numbers.
1.3a Use number sense to estimate and justify the reasonableness of solutions to problems involving real numbers.
Algebraic Methods
2.1 Model real world phenomena (for example, distance-versus-time relationships, compound interest, amortization tables, mortality rates) using functions, equations, inequalities, and matrices.2.1a Model real world phenomena involving linear, quadratic and exponential relationships using multiple representations of rules that can take the form of a recursive process, a function, an equation, or an inequality. (Compound Interest , Continuous Compound Interest )
2.2 Represent functional relationships using written explanations, tables, equations, and graphs and describe the connections among these representations.
2.2a Represent functional relationships using written explanations, tables, equations, and graphs, and describe the connections among these representations.
2.2b Convert from one functional representation to another. (Determining Slope , Graphs to Linear Equations , Graphs to Linear Equations 2 , Graphs to Linear Inequalities , Applied Linear Equations 1 , Applied Linear Equations 2 , Nonlinear Functions , Number Line Inequalities )
2.2c Interpret a graphical representation of a real-world situation.
2.3 Solve problems involving functional relationships using graphing calculators and/or computers as well as appropriate paper-and-pencil techniques.
2.3a Solve problems involving functions and relations using calculators, graphs, tables, and algebraic methods. (Quadratic Zero Equations , Quadratic Formula , Quadratic X-Intercepts )
2.3b Solve simple systems of equations using algebraic, graphical or numeric methods. (System of Equations Substitution , System of Equations Addition , Age Problems )
2.3c Solve equations with more than one variable for a given variable (for example, solve for p in I = prt or for r in C=2πr). (Triangle Area 2 , Rectangular Solids 2 , Distance, Rate, and Time , Two Variable Equations )
2.4 Analyze and explain the behaviors, transformations, and general properties of types of equations and functions (for example, linear, quadratic, exponential).
2.4a Identify and interpret x and y intercepts in the context of a problem.
2.4b Using a graph, identify the maximum and minimum value within a given domain. (Domain and Range )
2.4c Demonstrate horizontal and vertical translations on graphs of functions and their meanings in the context of a problem.
2.4d Recognize when a relation is a function.
2.5 Interpret algebraic equations and inequalities geometrically and describe geometric relationships algebraically.
2.5a Graph solutions to equations and inequalities in one-and two-dimensions. (Number Line Inequalities )
2.5b Express the perimeter, area and volume relationships of geometric figures algebraically.
2.5c Describe geometric relationships algebraically.
Data Analysis, Statistics, and Probability
3.1 Design and conduct a statistical experiment to study a problem, and interpret and communicate the results using the appropriate technology (for example, graphing calculators, computer software).3.1a Identify factors which may have affected the outcome of a survey (for example, biased questions or collection methods).
3.1b Draw conclusions about a large population based upon a properly chosen random sample.
3.1c Select and use an appropriate display to represent and describe a set of data (for example, scatter plot, line graph and histogram). (Line Graphs )
3.2 Analyze statistical claims for erroneous conclusions or distortions.
3.2a Check a graph, table or summary for misleading characteristics.
3.2b Recognize the misuse of statistical data in written arguments.
3.2c Describe how data can be interpreted in more than one way or be used to support more than one position in a debate.
3.2d Describe how the responses to a survey can be affected by the way the questions are phrased and/or by the reader's bias.
3.3 Fit curves to scatter plots using informal methods or appropriate technology to determine the strength of the relationship between two data sets and to make predictions.
3.3a Graph data sets, create a scatter plot, and identify the control (independent) variable and dependent variable. (Independent and Dependent Variables )
3.3b Determine a line of best fit from a scatter plot using visual techniques.
3.3c Predict values using a line of best fit.
3.3d Show how extrapolation may lead to faulty conclusions.
3.3e Recognize which model, linear or nonlinear, fits the data most appropriately.
3.4 Draw conclusions about distributions of data based on analysis of statistical summaries (for example, the combination of mean and standard deviation, and differences between the mean and median).
3.4a Differentiate between mean, median, and mode and demonstrate the appropriate use of each. (Mean, Median, Mode )
3.4b Recognize and classify various types of distributions (for example, bimodal, skewed, uniform, binomial, normal).
3.4c Use the mean and standard deviation to determine relative positions of data points in a normal distribution of authentic data.
3.4d Demonstrate how outliers might affect various representations of data and measures of central tendency.
3.5 Use experimental and theoretical probability to represent and solve problems involving uncertainty (for example, the chance of playing professional sports if a student is a successful high school athlete).
3.5a Determine the probability of an identified event using the sample space. (Probability , Probability 2 , Object Picking Probability )
3.5b Distinguish between experimental and theoretical probability and use each appropriately.
3.5c Differentiate between independent and dependent events to calculate the probability in real-world situations. (Object Picking Probability )
3.5d Calculate the probability of event A and B occurring and the probability event A or B occurring.
3.5e Use area models to determine probability (for example, the probability of hitting the bull's eye region in a target).
3.6 Solve real-world problems with informal use of combinations and permutations for example, determining the number of possible meals at a restaurant featuring a given number of side dishes).
3.6a Apply organized counting techniques to determine combinations and permutations in problem solving situations.
Geometry
4.1 Find and analyze relationships among geometric figures using transformations (for example, reflections, translations, rotations, dilations) in coordinate systems.4.1a Describe and apply the properties of similar and congruent figures. (Proportions 2 )
4.1b Solve problems involving symmetry and transformations.
4.1c Use coordinate geometry and/or tessellations to solve problems
4.1d Describe cylinders, cones and spheres that result from the rotation of rectangles, triangles and semicircles about a line.
4.2 Derive and use methods to measure perimeter, area, and volume of regular and irregular geometric figures.
4.2a Use the Pythagorean theorem and its converse to solve real-world problems.
4.2b Use properties of polygons to find areas of regular and irregular figures. (Irregular Shape Areas , Perimeter and Area of Composite Figures )
4.2c Use properties of geometric solids to find volumes and surface areas of regular and irregular geometric solids. (Rectangular Solids , Triangular Prisms , Cylinders )
4.3 Make and test conjectures about geometric shapes and their properties, incorporating technology where appropriate.
4.3a Make and test conjectures about geometric shapes and their properties to include parallelism and perpendicularity, numerical relationships on a triangle, relationships between triangles, and properties of quadrilaterals and regular polygons. (Quadrilateral Angles , Triangle Area , Identifying Angles , Polygon Angles )
4.3b Apply geometric relationships such as parallelism and perpendicularity, numerical relationships on a triangle, relationships between triangles, and properties of quadrilaterals and regular polygons to solve problems. (Triangle Angles , Quadrilateral Angles , Triangle Angles 2 , Solving For Angles , Polygon Angles , Angle Measurements , Angle Measurements 2 )
4.4 Use trigonometric ratios in problem solving situations (for example, finding the height of a building from a given point, if the distance to the building and the angle of elevation are known).
4.4a Use right triangle trigonometry to solve real-world problems.
Measurement
5.1 Measure quantities indirectly using techniques of algebra, geometry, or trigonometry.5.1a Use appropriate measurements to solve problems indirectly (for example, find the height of a flagpole using similar triangles.
5.1b Use measurement to solve real-world problems involving rate of change (for example, distance traveled using rate and time). (Unit Cost , Distance, Rate, and Time , Train Problems )
5.1c Given the rate of change, model real-world problems algebraically or graphically.
5.1d Describe how changing the measure of one attribute of a geometric figure affects the other measurements. (Area And Volume Proportions )
5.2 Select and use appropriate tools and techniques to measure quantities in order to achieve specified degrees of precision, accuracy and error (or tolerance) of measurements.
5.2a Select and use appropriate tools and techniques to measure quantities in order to achieve specified degrees of precision, accuracy, and error of measurements.
5.2b Given commonly used multi-dimensional figures, determine what units and measurements need to be taken.
5.3 Determine the degree of accuracy of a measurement (for example, by understanding and using significant details).
5.3a Determine the number of significant digits when measuring and calculating with those measurements.
Mathematical Reasoning
6.1 Use ratios, proportions, and percents in problem solving situations.6.1a Use ratios, proportions, and percents in problem solving situations that involve rational numbers. (Percentage Change , Purchases At Stores , Restaurant Bills , Commissions , Percent of Quantity , Proportions 2 )
6.1b Convert from one set of units to another using proportions (for example, feet/minute to miles/hour). (Distance Conversion , Time Conversion , Volume Conversion , Weight Conversion , Temperature Conversion , Area and Volume Conversions )
6.1c Apply direct variation to problem solving situations.
6.2 Select and use appropriate methods for computing with real numbers in problem-solving situations from among mental arithmetic, estimation, paper-and-pencil, calculator, and computer methods, and determine whether the results are reasonable.
6.2a Apply appropriate computational methods to solve multi-step problems involving all types of numbers from the real number system. (Single Variable Equations 2 , Single Variable Equations 3 , Single Variable Inequalities , Absolute Value 2 , Absolute Value Equations , Simplifying Algebraic Expressions , Simplifying Algebraic Expressions 2 , System of Equations Substitution , System of Equations Addition , Age Problems , Train Problems , Mixture Word Problems , Work Word Problems , Integer Word Problems )
6.3 Describe the limitations of estimation and assessing the amount of error resulting from estimation within acceptable tolerance limits.
6.3a Determine when estimation is an appropriate method to solve a problem and describe what error might result from estimation.
Learn more about our online math practice software.

|
"MathScore works."
- John Cradler, Educational Technology Expert |